$19.95
per editor/month or $199.50 billed annually
Please log in or sign up to order
Unlimited Binders
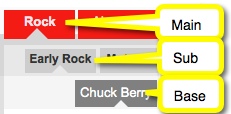
3 levels of tabs
Individual Storage
Storage of up to 50GB
File size upload limit of 75MB
Private Uploads
Collaborator Upload
Rename File
Email Binder Icon
Control Binder Info View
Rounded Tabs
Download Binder
Hide URL
SEO
Premium Support
After you complete your order, click this button to reload the editor with your new features:
LiveBinders Professional Pricing
Please Pick an Option:
Uploaded documents are not secured with the free service. With a subscription, document uploads are locked to a binder and not accessible outside the binder. Please see our document security page for more information.
Premium Support
We answer all support queries through email or twitter. Premium support guarantees a response to your question within 24 hours.
Collaborator Upload
Collaborators can upload to a binder owner's account as long as both the collaborator and the binder owner are subscribers.
This feature is useful for organizations and individuals who want to control a binder's content centrally.
Rename File
Upgrade to our Pro plan to rename any file that you have uploaded to your binder on the Uploaded File page.
Hide URL
Want a cleaner looking tab page? Upgrade to a Pro plan and hide the URL that is displayed above the content.
This feature is useful when you have mostly uploaded files in your binder.
Email Binder Icon
You can share your binder via email inside the LiveBinders system and we will send your binder icon to the people you wish to share it with.
Control Binder Info View
You can choose to display or remove views, rating, comments, and the link to featured binder from your binder when it is viewed.
You can choose to display or remove the url that appears above the content in each tab in the binder.
Manage Accounts Option
You can create new accounts, manage passwords, change email addresses on accounts, assign storage allocation, and view all binders/media objects for each user.
Group Access Option
Members can assign group access to binders known as "Limited" access. This is like 'private' access but accessible to anyone in the Organization without needing an access key.
Shared Storage Option
You can set up individual storage allocations for different accounts. Shared storage gives members in the organization flexibility as some members will use more storage than others.
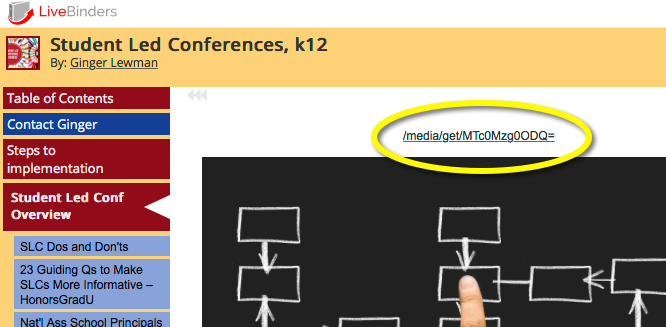
LiveBinders always puts a link to any embedded content above the content which lets people open the content in a separate window. You can optionally remove this link with any subscription plan.
SEO
LiveBinders are not indexed by search engines. With your subscription account, your public LiveBinders will be indexed by search engines automatically. For more information about search engine optimization, please see this page.
Download Binder
You can create an offline or archived version of your binder that will run without an Internet connection. Ideal for binders with uploaded files. Any web links in the binder will require an Internet connection to view.
Unlimited Binders
3 levels of tabs
Shared Storage
Storage options up to 1TB
File size upload limit of 75MB
Private Uploads
Collaborator Upload
Email Binder Icon
Control Binder Info View
Rounded Tabs
Hide URL
Download Binder
SEO
Premium Support
Manage Accounts Option
Group Access Option
Shared Storage Option
Private Uploads
Uploaded documents are not secured with the free service. With a subscription, document uploads are locked to a binder and not accessible outside the binder. Please see our document security page for more information.
Premium Support
We answer all support queries through email or twitter. Premium support guarantees a response to your question within 24 hours.
Collaborator Upload
Collaborators can upload to a binder owner's account as long as both the collaborator and the binder owner are subscribers.
This feature is useful for organizations and individuals who want to control a binder's content centrally.
Rename File
Upgrade to our Pro plan to rename any file that you have uploaded to your binder on the Uploaded File page.
Hide URL
Want a cleaner looking tab page? Upgrade to a Pro plan and hide the URL that is displayed above the content.
This feature is useful when you have mostly uploaded files in your binder.
Email Binder Icon
You can share your binder via email inside the LiveBinders system and we will send your binder icon to the people you wish to share it with.
Control Binder Info View
You can choose to display or remove views, rating, comments, and the link to featured binder from your binder when it is viewed.
You can choose to display or remove the url that appears above the content in each tab in the binder.
Manage Accounts Option
You can create new accounts, manage passwords, change email addresses on accounts, assign storage allocation, and view all binders/media objects for each user.
Group Access Option
Members can assign group access to binders known as "Limited" access. This is like 'private' access but accessible to anyone in the Organization without needing an access key.
Shared Storage Option
You can set up individual storage allocations for different accounts. Shared storage gives members in the organization flexibility as some members will use more storage than others.
LiveBinders always puts a link to any embedded content above the content which lets people open the content in a separate window. You can optionally remove this link with any subscription plan.
SEO
LiveBinders are not indexed by search engines. With your subscription account, your public LiveBinders will be indexed by search engines automatically. For more information about search engine optimization, please see this page.
Download Binder
You can create an offline or archived version of your binder that will run without an Internet connection. Ideal for binders with uploaded files. Any web links in the binder will require an Internet connection to view.
Educators, students, and non-profits receive the 50% discounted price reflected below. After you upgrade, please fill out this form as proof of your education, non-profit, or certified status.
Basic
$35
per editor/year
Please log in or sign up to order
Unlimited Binders
3 levels of tabs
Storage of up to 1GB
File size upload limit of 50MB
Private Uploads
Collaborator Upload
Email Binder Icon
Control Binder Info View
Rounded Tabs
SEO
Private Uploads
Uploaded documents are not secured with the free service. With a subscription, document uploads are locked to a binder and not accessible outside the binder. Please see our document security page for more information.
Premium Support
We answer all support queries through email or twitter. Premium support guarantees a response to your question within 24 hours.
Collaborator Upload
Collaborators can upload to a binder owner's account as long as both the collaborator and the binder owner are subscribers.
This feature is useful for organizations and individuals who want to control a binder's content centrally.
Rename File
Upgrade to our Pro plan to rename any file that you have uploaded to your binder on the Uploaded File page.
Hide URL
Want a cleaner looking tab page? Upgrade to a Pro plan and hide the URL that is displayed above the content.
This feature is useful when you have mostly uploaded files in your binder.
Email Binder Icon
You can share your binder via email inside the LiveBinders system and we will send your binder icon to the people you wish to share it with.
Control Binder Info View
You can choose to display or remove views, rating, comments, and the link to featured binder from your binder when it is viewed.
You can choose to display or remove the url that appears above the content in each tab in the binder.
Manage Accounts Option
You can create new accounts, manage passwords, change email addresses on accounts, assign storage allocation, and view all binders/media objects for each user.
Group Access Option
Members can assign group access to binders known as "Limited" access. This is like 'private' access but accessible to anyone in the Organization without needing an access key.
Shared Storage Option
You can set up individual storage allocations for different accounts. Shared storage gives members in the organization flexibility as some members will use more storage than others.
LiveBinders always puts a link to any embedded content above the content which lets people open the content in a separate window. You can optionally remove this link with any subscription plan.
SEO
LiveBinders are not indexed by search engines. With your subscription account, your public LiveBinders will be indexed by search engines automatically. For more information about search engine optimization, please see this page.
Download Binder
You can create an offline or archived version of your binder that will run without an Internet connection. Ideal for binders with uploaded files. Any web links in the binder will require an Internet connection to view.
After you complete your order, click this button to reload the editor with your new features:
LiveBinders Educator Basic Plan Available to verified educators/students, non-profits and Green Plus Certified or Certified B Corps*
Please log in or sign up to order
Unlimited Binders
3 levels of tabs
Individual Storage
Storage of up to 50GB
File size upload limit of 75MB
Private Uploads
Collaborator Upload
Rename File
Email Binder Icon
Control Binder Info View
Rounded Tabs
Hide URL
Download Binder
SEO
Premium Support
Private Uploads
Uploaded documents are not secured with the free service. With a subscription, document uploads are locked to a binder and not accessible outside the binder. Please see our document security page for more information.
Premium Support
We answer all support queries through email or twitter. Premium support guarantees a response to your question within 24 hours.
Collaborator Upload
Collaborators can upload to a binder owner's account as long as both the collaborator and the binder owner are subscribers.
This feature is useful for organizations and individuals who want to control a binder's content centrally.
Rename File
Upgrade to our Pro plan to rename any file that you have uploaded to your binder on the Uploaded File page.
Hide URL
Want a cleaner looking tab page? Upgrade to a Pro plan and hide the URL that is displayed above the content.
This feature is useful when you have mostly uploaded files in your binder.
Email Binder Icon
You can share your binder via email inside the LiveBinders system and we will send your binder icon to the people you wish to share it with.
Control Binder Info View
You can choose to display or remove views, rating, comments, and the link to featured binder from your binder when it is viewed.
You can choose to display or remove the url that appears above the content in each tab in the binder.
Manage Accounts Option
You can create new accounts, manage passwords, change email addresses on accounts, assign storage allocation, and view all binders/media objects for each user.
Group Access Option
Members can assign group access to binders known as "Limited" access. This is like 'private' access but accessible to anyone in the Organization without needing an access key.
Shared Storage Option
You can set up individual storage allocations for different accounts. Shared storage gives members in the organization flexibility as some members will use more storage than others.
LiveBinders always puts a link to any embedded content above the content which lets people open the content in a separate window. You can optionally remove this link with any subscription plan.
SEO
LiveBinders are not indexed by search engines. With your subscription account, your public LiveBinders will be indexed by search engines automatically. For more information about search engine optimization, please see this page.
Download Binder
You can create an offline or archived version of your binder that will run without an Internet connection. Ideal for binders with uploaded files. Any web links in the binder will require an Internet connection to view.
After you complete your order, click this button to reload the editor with your new features:
LiveBinders Educator Pro Plan Available to verified educators/students, non-profits and Green Plus Certified or Certified B Corps*